Over 15 years ago we set out to determine what drives the market in a particular direction. We hypothesized that psychology and social behaviour were the dominant forces in sending the market in whatever direction it was taking.
Our scientists applied mathematical psychology models to analyze data, directly from the order book of exchanges. They discovered that psychology and social behaviour did indeed drive the market and not necessarily empirical data alone. Additionally, our scientists found that although speed is paramount to compete, it wasn't the speed of computing that needed further improvement. It was the speed of comprehending the meaning of things and their implications in the market.
Based on this research, we developed a Market Data Intelligence platform. A real-time market perception and sentiment system based on using unique algorithms that analyze market participant activities to extract behavioural data in real-time.
Mathematical Psychology is a unique branch of Artificial Intelligence based on mathematical modelling of perceptual, cognitive and motor processes of humans as individuals and as collectives. Using this unique branch AI in our research and having applied it to our solutions, we empower our human intuitive abilities to intelligently interact with electronic markets.
The design paradigm of current investment and trading systems allows traders to compare numbers or charts. Our scientists, through their research, related to the psychological effects of linear representation of data known as the price bar charts (along with any other charts such as candlestick, line, Renko etc.) determined that in a complex and rapidly changing environment, it is more efficient to represent key data symbolically, not literally.
Price charts disregard the relative movement of the price vs. its very recent behaviour. For example, a rapid rise of the price on a 1 min bar chart might trigger a different interpretation depending on how the price behaved relative to the rate of change measured on multiple time frames. By looking at one chart, a trader becomes isolated from the vital information to what a price move means when registered at a single time.
A Hybrid Approach
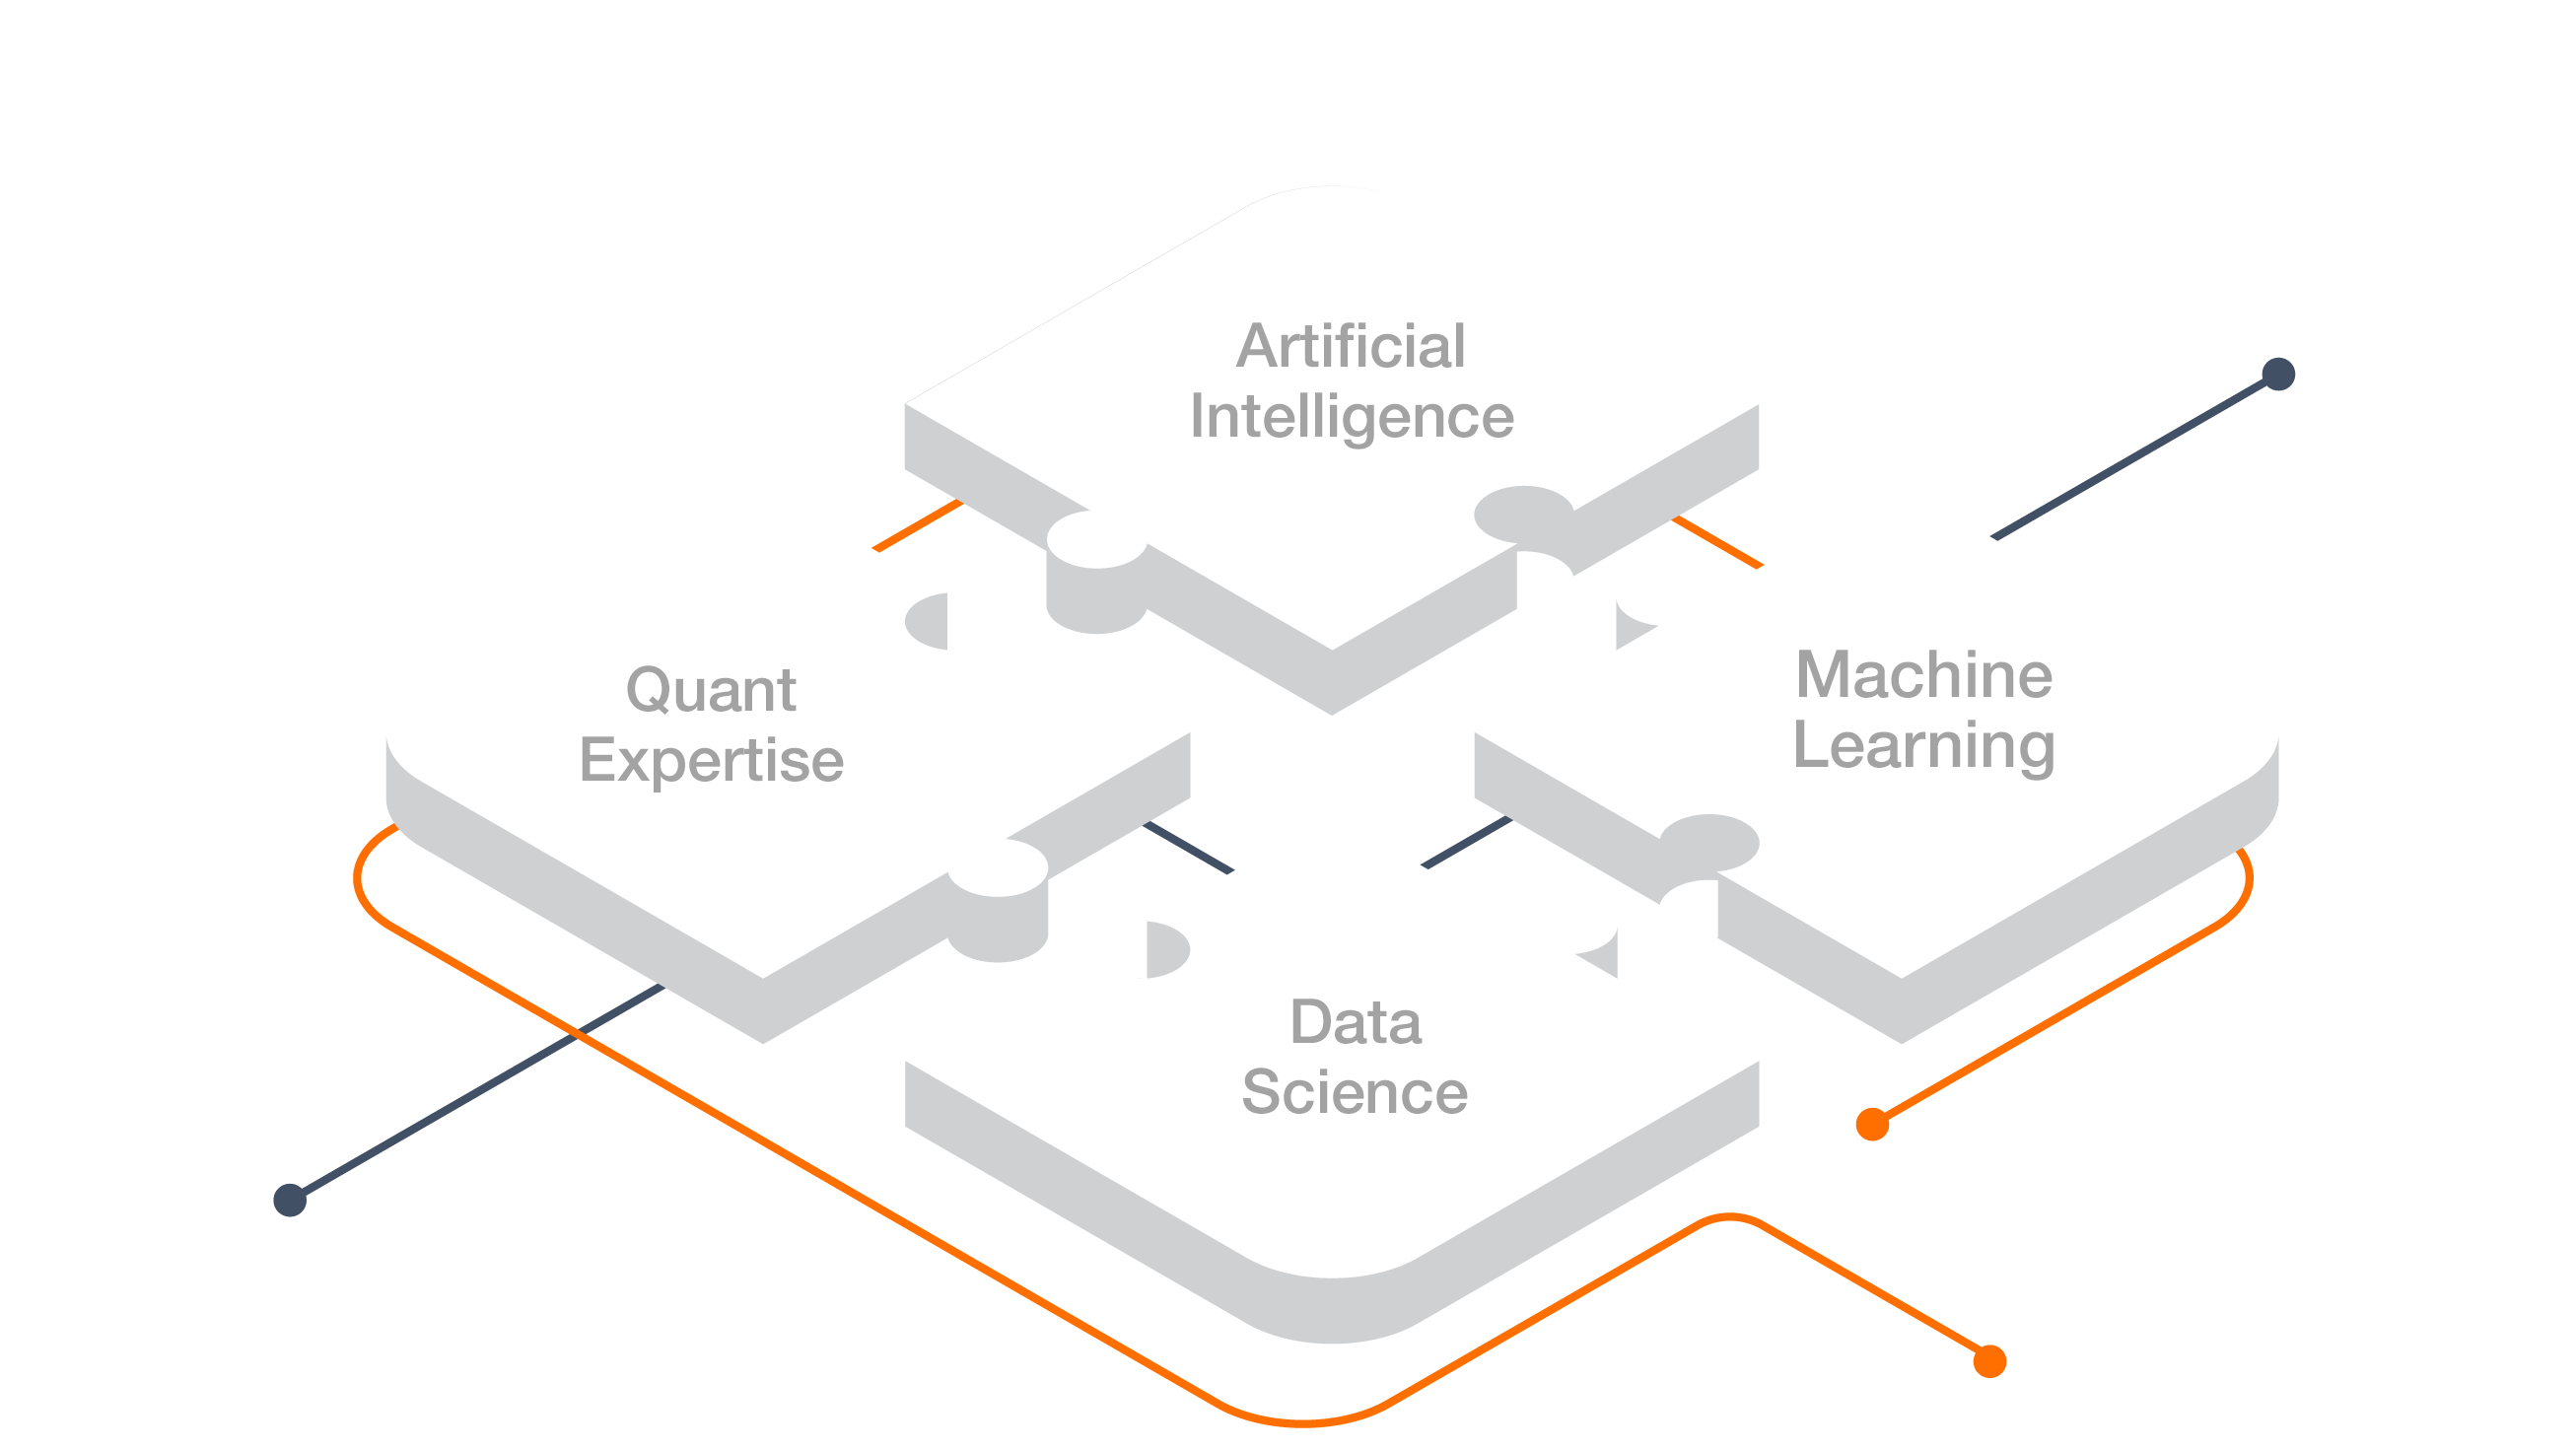
A platform diversified in thought and methodology. Distributed for scale, QuantGate's platform applies multi-disciplinary scientific methodologies to extract perception and intent from raw real-time data.

A Domain Driven Approach
A systematic, layered set of processes and systems combined to deliver a scalable and robust intelligence platform to power mobile, desktop, web and SaaS based solutions via a set of enterprise APIs and products.

Core Algorithms
“A way of regarding, understanding, or interpreting something; a mental impression.”
This unique algorithm extracts and quantifies cognitive behavioral characteristics of active market participants (traders) to provide an indication of their overall (collective) real-time perception. This effectively indicates the overall perceived value of the market from the viewpoint of the currently active market participants.
Providing a real-time perception of the market alleviates traders from having to make (uninformed) decisions based on their (own personal) perceived value of the market and eliminates guess work as to which direction the market will head. This also prevents traders from having to resort to outside sources of confirmation such as social media, news, or other biased interpretations of market perception.
“The state or quality of being dedicated to a cause or activity.”
Commitment quantifies information about traders’ intentions to buy or sell a security in a market. The commitment algorithm effectively extracts trader intent and the overall commitment of the market to continue heading in the current direction. Many historical attempts have been made to quantify “The Trader’s Commitment”, and Pilot’s cutting-edge machine learning framework achieves this by quantifying the psychological state of the traders and their levels of intent (commitment) to participate in the market’s current price action direction.
The commitment algorithm extracts information based on behaviour of traders as a result of other market conditions. For example, it is a well-known psychological phenomenon that the majority of traders make their buy decisions when they believe that the price has fallen too far, too fast. Conversely, they tend to sell a security if its price has risen too far, too fast. If this situation occurs, it usually manifests itself through a variety of emotional responses such as an increased number of order cancellations that are taking place on the buy or sell side by different trading groups. By measuring the relative order cancellation frequency and comparing to the trader group profile monitored over time within the market (to prevent false positives), the commitment algorithm effectively indicates the overall (collective) intent of traders in the market to buy or sell a security.
“A state of rest or balance due to the equal action of opposing forces”
The Equilibrium algorithm indicates the overall deviation of the market (emotional deviation) from the market’s actual (fair) value. This enables a trader to realize the magnitude of that emotional response and size their order (risk) relative to the potential profit (reward). The basic premise behind this unique algorithm is in the fact that the market is composed or induced with an overall emotional state.
The Equilibrium’s proprietary mathematical formulae indicate this emotional state in real time enabling a trader to comprehend when a reversion to the mean is about to occur after the perception and commitment algorithms are in agreement (both indicating the same market condition).
“A feeling or emotional state as a result of one’s perception”
Each market is composed of multiple groups and types of traders that exhibit unique (and unpredictable) behavioral characteristics at different times. The complexity involved in measuring market sentiment is mainly due to multiple market participants basing their trading decisions in multiple (unknown) timeframes (and often times, different time zones), and based on multiple different reasons.
The Sentiment algorithm, vividly visualized by the shape of the Sentiment Spectrum, indicates the current sentiment of all groups of market participants (traders) and their contribution to price change in real time. The color of the Sentiment spectrum indicates the (aggregated) anticipated sentiment shift of all different trading groups classified in real time by the algorithm on a per market basis. This, together with the Perception, Commitment and Equilibrium algorithms all confirming (at the same time) leaves only the sentiment algorithm to indicate the final confirmation and exact (optimized) time of order entry. The Sentiment Algorithm effectively confirms the real perception of the market and enables comprehension (with ease) to accurately time order entry.